
The median Shopify store converts at about 1.4%, with the average slightly higher. Stores converting well above this range are considered top performers. Those are the numbers worth knowing before anything else.
Your Shopify conversion rate is simply orders divided by total sessions, multiplied by 100. It tells you what percentage of visits end in a purchase. But a single blended figure without context can mislead you badly.
Industry and device shape your benchmark more than any global average. Health and wellness stores typically convert at higher rates than fashion and apparel, which in turn convert at higher rates than home and furniture. A furniture store at 1.4% is not broken. Comparing it to a supplements benchmark would send you chasing the wrong problems entirely.
Device splits the picture further. Desktop generally converts at a higher median rate than mobile, which drives the majority of traffic but a smaller share of revenue. That gap is where most UK stores leave money on the table.
Quick benchmarking criteria to check first:
-
Industry vertical (supplements and food convert higher than furniture or electronics)
-
Device (mobile vs desktop as separate funnels)
-
Traffic source (email converts at 4.0–5.5%, paid social at 0.8–1.5%)
-
Store maturity (returning visitors convert at 3.2% vs 0.9% for new visitors)
How do you measure your Shopify conversion rate accurately?
The formula is straightforward: orders divided by sessions. You can find this in Shopify Admin under Analytics, or pull it through Google Analytics 4 for deeper attribution. The number you see in your dashboard is the session-based rate, which is the standard definition and the one all benchmarks above use.

The real value comes from segmentation. Treating mobile and desktop as separate funnels gives you a far clearer picture than a blended rate. A store with 3% desktop and 0.8% mobile is not a low performer overall. It has a mobile experience problem, and that is a very different fix.
Beyond the headline rate, track these funnel metrics together:
-
Add-to-cart (ATC) rate: sessions with an add-to-cart event divided by total sessions
-
Cart-to-checkout rate: checkout initiations divided by add-to-cart events
-
Checkout-to-purchase rate: completed orders divided by checkout initiations
-
Average order value (AOV): total revenue divided by number of orders
Low ATC points to a product page or pricing problem. Low cart-to-checkout usually means a shipping cost surprise. Low checkout-to-purchase suggests a trust or payment issue. Each stage tells you something different.
Free tools like Microsoft Clarity let you watch session recordings and heatmaps to spot exactly where visitors drop off. That kind of visual evidence saves you from guessing.
Pro Tip: Before you change anything, pull your funnel metrics by device and traffic source. The stage where you trail your category benchmark is your leak. Fix that first.
Common misconceptions about ecommerce conversion rates
A few beliefs trip up even experienced store owners. Getting these straight saves a lot of wasted effort.
-
“More traffic means more revenue.” Not if your conversion rate is low. A store converting at 1% needs to double its traffic to match the revenue of the same store converting at 2%. Fix the rate first, then scale spend.
-
“The homepage is the most important page to optimise.” A significant share of traffic lands directly on product pages. The homepage rarely sees that volume.
-
“My 2% rate is fine because it beats the 1.4% average.” The 1.4% average includes stores with barely any traffic. Compare against your industry’s top quartile, not the overall mean.
-
“Checkout is always the biggest bottleneck.” Most stores under 1% have a product page or traffic quality problem, not a checkout problem. Fixing checkout on a leaky funnel rarely moves the number.
-
“CRO improvements happen quickly.” Compounding gains from systematic work typically take six to twelve months to show fully.
Stores converting below 0.5% almost always have a fundamental issue: broken checkout, slow load times, poor traffic quality, or a product-market fit problem. Tactics do not fix those. Diagnosis does.
Top strategies to improve your Shopify conversion rate in 2026
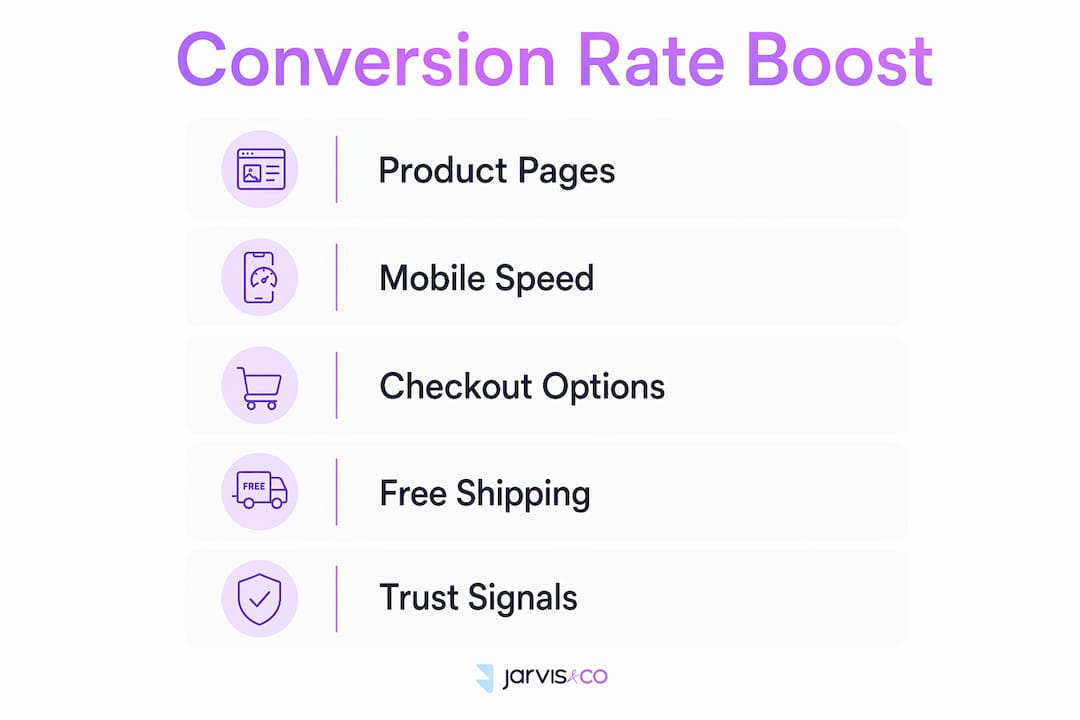
The four levers that explain most of the variance in Shopify conversion rates are product page clarity, mobile speed, checkout friction, and trust. Work through them in that order.
Product pages first
A large portion of your traffic lands on product pages, making them the highest-leverage place to spend your time. Benefit-led copy, at least five quality images (front, back, detail, lifestyle, scale), and visible reviews near the product title all move the needle. A product with “4.7 stars, 312 reviews” visible immediately is more persuasive than any headline you write.
Mobile experience
Mobile drives the majority of Shopify traffic but converts at a significantly lower rate than desktop. Sticky add-to-cart buttons that stay visible as visitors scroll, tap targets large enough to use with a thumb, and a page that loads in under 2.5 seconds on a 4G connection are the fixes with the highest return. Strip out overlapping pop-ups and cookie banners that cover the buy button on small screens.

Checkout optimisation
Multiple payment options including Shop Pay, Apple Pay, and Klarna reduce abandonment at the final step. Shop Pay alone boosts checkout completion by up to 50% over guest checkout. Trust badges near the card field, transparent shipping costs shown before checkout, and a simplified form (fewer fields, no forced account creation) each reduce drop-off.
Free shipping thresholds
Set your free shipping threshold moderately above your current average order value, as many shoppers add items to their cart just to qualify, raising both AOV and conversion.
| Tactic | Primary impact | Effort |
|---|---|---|
| Sticky add-to-cart button (mobile) | ATC rate | Low |
| Product page reviews visible above fold | Conversion rate | Low |
| Shop Pay / Apple Pay at checkout | Checkout completion | Low |
| Page speed under 2.5s | All stages | Medium |
| Free shipping threshold | AOV + conversion | Low |
| A/B test hero image or CTA copy | Conversion rate | Medium |
Pro Tip: Use Microsoft Clarity session recordings before applying any tactic. Watch where real visitors hesitate or drop off. That ten minutes of observation tells you more than a month of guessing.
A/B testing only works reliably once you have roughly 50,000 monthly sessions on the page being tested. Below that, deploy the change and monitor the trend over three to four weeks instead.
What UK ecommerce specialists know about CRO
CRO is a diagnostic loop, not a checklist. The process is: measure, find the friction, fix the biggest friction, then measure again. Skipping the measurement step and jumping straight to tactics is the most common reason stores see no improvement despite making changes.
UK shoppers respond particularly well to specific trust signals. Clear returns policies, recognisable payment logos (Visa, Mastercard, PayPal, Shop Pay), and delivery date estimates (“arrives by Thursday”) outperform vague shipping ranges. Concrete dates reduce uncertainty in a way that “3–5 business days” simply does not.
At Jarvisandco, the approach to Shopify store design centres on those same four levers. Visual hierarchy that guides the eye to the buy button, trust signals placed at the moments of hesitation, and mobile layouts built for thumbs rather than cursors. The Leigh & Co case study shows how design-led changes to product page layout and trust signal placement produced measurable conversion improvements without touching ad spend.
Key principles UK practitioners apply consistently:
-
Prioritise mobile UX before desktop refinements
-
Place social proof (reviews, ratings, UGC) at the point of decision, not the footer
-
Use Yotpo or similar review platforms to collect and display verified reviews at scale
-
Fix page speed before any other optimisation
How customer behaviour shapes your conversion rate
Understanding why visitors behave the way they do is more useful than any single tactic. New visitors convert at relatively low rates on average whereas returning visitors, email subscribers, and loyalty program members convert at successively higher rates. The pattern is clear: familiarity and trust drive purchases far more than any single page element.
Traffic source intent matters just as much. A visitor arriving from a branded search query already wants to buy. Someone clicking a cold paid social ad is still deciding whether to trust you. Treating both with the same product page and checkout flow ignores a fundamental difference in where they are in their decision.
Session recordings and heatmaps (Microsoft Clarity is free) reveal the specific moments where intent breaks down. Visitors who scroll past the fold but do not click add-to-cart usually have a trust or pricing objection. Visitors who bounce immediately have a traffic quality or above-the-fold relevance problem. Each pattern points to a different fix.
How pricing and discounting affect conversions
Pricing decisions affect conversion rate more directly than most store owners expect. Lower price points convert at higher rates: products under £25 typically convert well above the store average, while products over £200 convert at a fraction of that rate. That is not a flaw in your store. It reflects the consideration time buyers need before committing to a larger purchase.
Discounting works, but the mechanics matter. Genuine strikethrough pricing (a real previous price, not a manufactured one) builds trust and lifts conversion. Permanent “sale” badges on every product do the opposite. Buy-now-pay-later options like Klarna or Clearpay reduce the psychological barrier of a larger purchase and can increase AOV meaningfully for products above £50.
Free shipping thresholds, as noted earlier, are one of the cleanest pricing levers available. They lift both AOV and conversion simultaneously, with no margin sacrifice on orders that already exceed the threshold.
How marketing channels influence your Shopify conversion rate
Not all traffic is equal, and your blended conversion rate reflects your channel mix as much as your store quality. Email marketing converts at substantially higher rates due to trust and familiarity, while cold paid social converts at notably lower rates.
The practical implication: if you scale paid social spend, your blended conversion rate will fall even if your store is performing well. That is not a store problem. It is a channel mix shift. Always segment by source before drawing conclusions about store performance.
Paid search (Google Ads) sits in the middle at 1.5–2.5% for broad product campaigns, rising to 3.5–5.0% for branded campaigns. Organic search delivers 2.2–3.0% on average, with product-intent queries at the higher end and informational queries at the lower end.
How to use A/B testing on Shopify without wasting time
A/B testing is the most overused and underused CRO tool at the same time. Overused because stores run tests on pages with too little traffic to reach statistical significance. Underused because stores that do have the traffic often test the wrong things.
The threshold that matters: roughly 50,000 monthly sessions on the specific page being tested before a test can produce reliable results. Below that, deploy the change and monitor the trend over three to four weeks. A consistent upward shift in your funnel metrics is a valid signal even without formal significance.
When you do have sufficient traffic, test one variable at a time. Hero image versus alternative hero image. CTA button colour or copy. Trust badge placement. Each test should have a clear hypothesis tied to a specific friction point you have already identified through session data. Testing randomly wastes the traffic you have.
Key takeaways
The most effective way to improve your Shopify conversion rate is to diagnose the specific stage of your funnel that lags your industry benchmark, then fix that friction before moving to the next.
| Point | Details |
|---|---|
| Benchmark by industry and device | The median is 1.4% overall, but health stores reach 2.5–4.5% and apparel stores convert at 1.5–3.0%. |
| Mobile is a separate funnel | Desktop generally converts at a higher median rate than mobile; fix mobile UX before anything else. |
| Product pages drive most conversions | 40–60% of traffic lands there first, making them the highest-leverage optimisation target. |
| Channel mix shapes your blended rate | Email converts at 4.0–5.5%; cold paid social at 0.8–1.5%. Segment before judging store performance. |
| A/B test only with sufficient traffic | Below 50,000 monthly sessions on a page, deploy and monitor trends instead of running formal tests. |
Ready to improve your Shopify store’s conversion rate?

If your store is getting traffic but not converting, the problem is usually design, trust signals, or mobile experience. Jarvisandco specialises in Shopify store design built specifically to convert visitors into customers, from product page layout to checkout flow. We work with businesses across the UK, including right here in East Yorkshire.
Get in touch and we will take a look at your store. No jargon, no hard sell. Just honest advice on where the biggest gains are hiding.